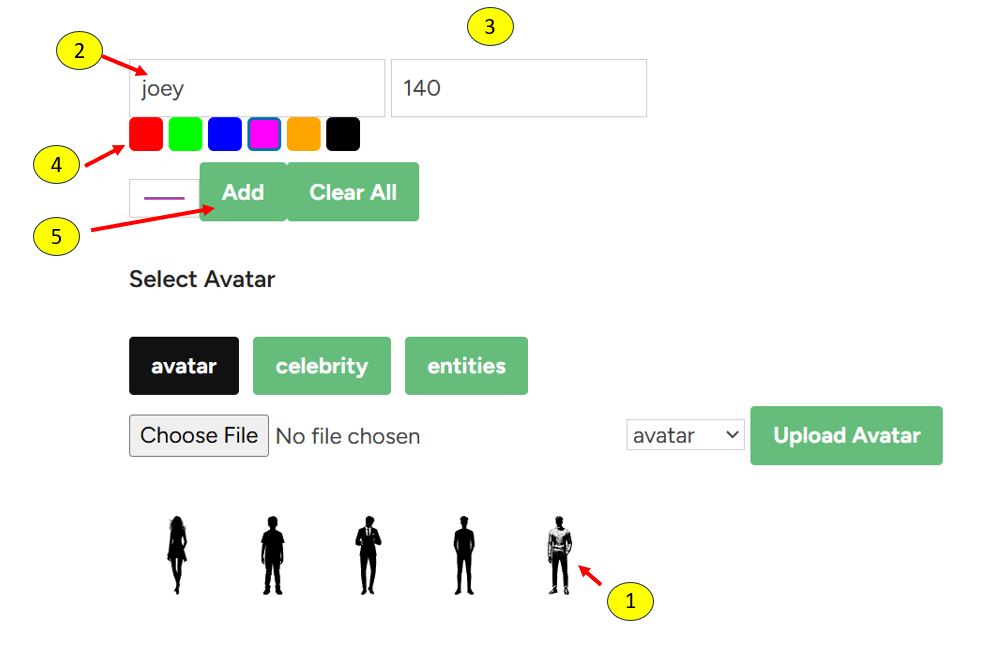
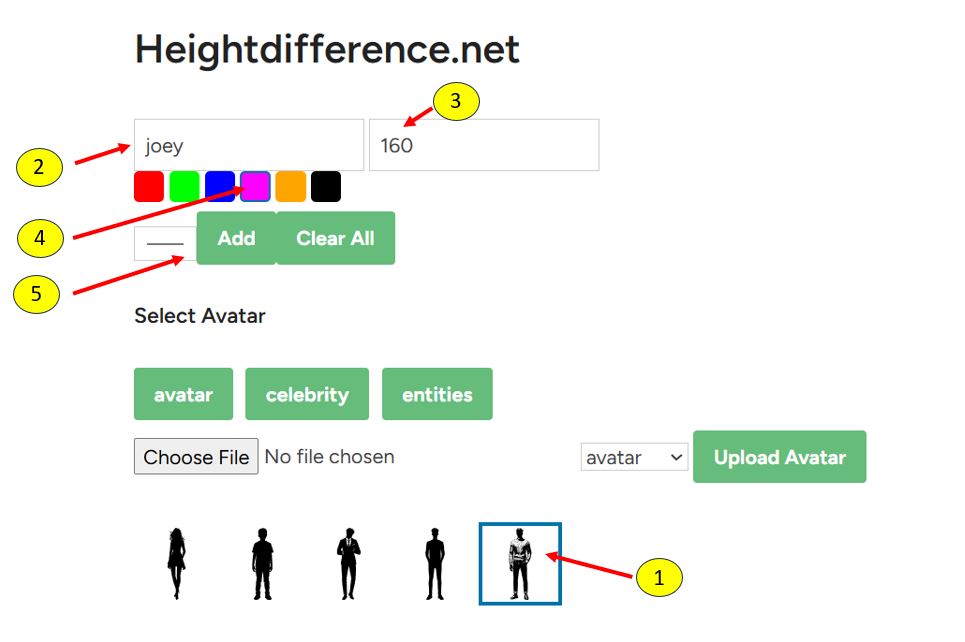
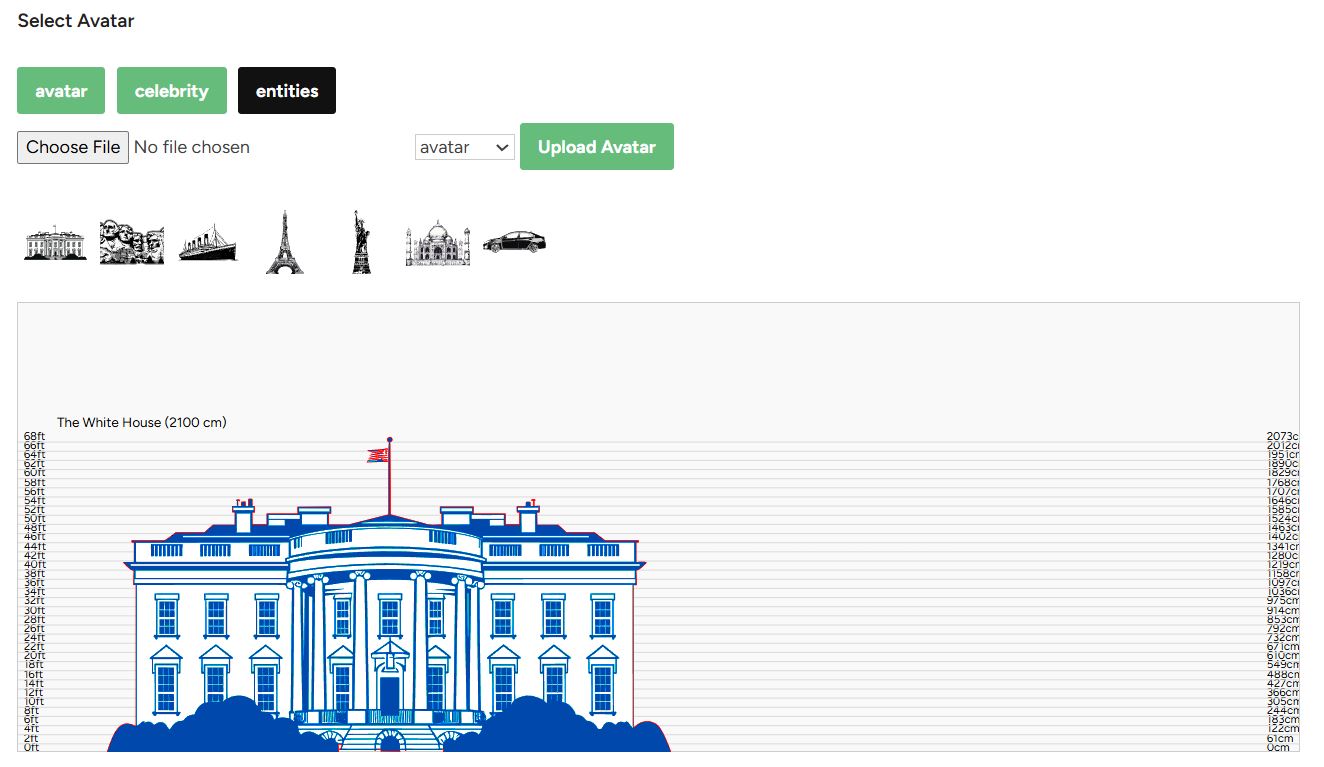
Select Avatar
How to Use the Height Difference Tool:
Overview
The Heightdifference.net allows you to visually compare heights of various avatars, celebrities, animals, and entities on a vertical scale. You can add figures by selecting avatars, entering height and name, or by clicking predefined items. This is a great and fun way to visualize and compare the height differences of many people in relation to others.
Getting Started
Categories / Tabs
- The plugin organizes avatars into categories: Avatar, Celebrity, Animals, Entities, etc.
- Click a category tab to view its avatars.
How to Add Figures
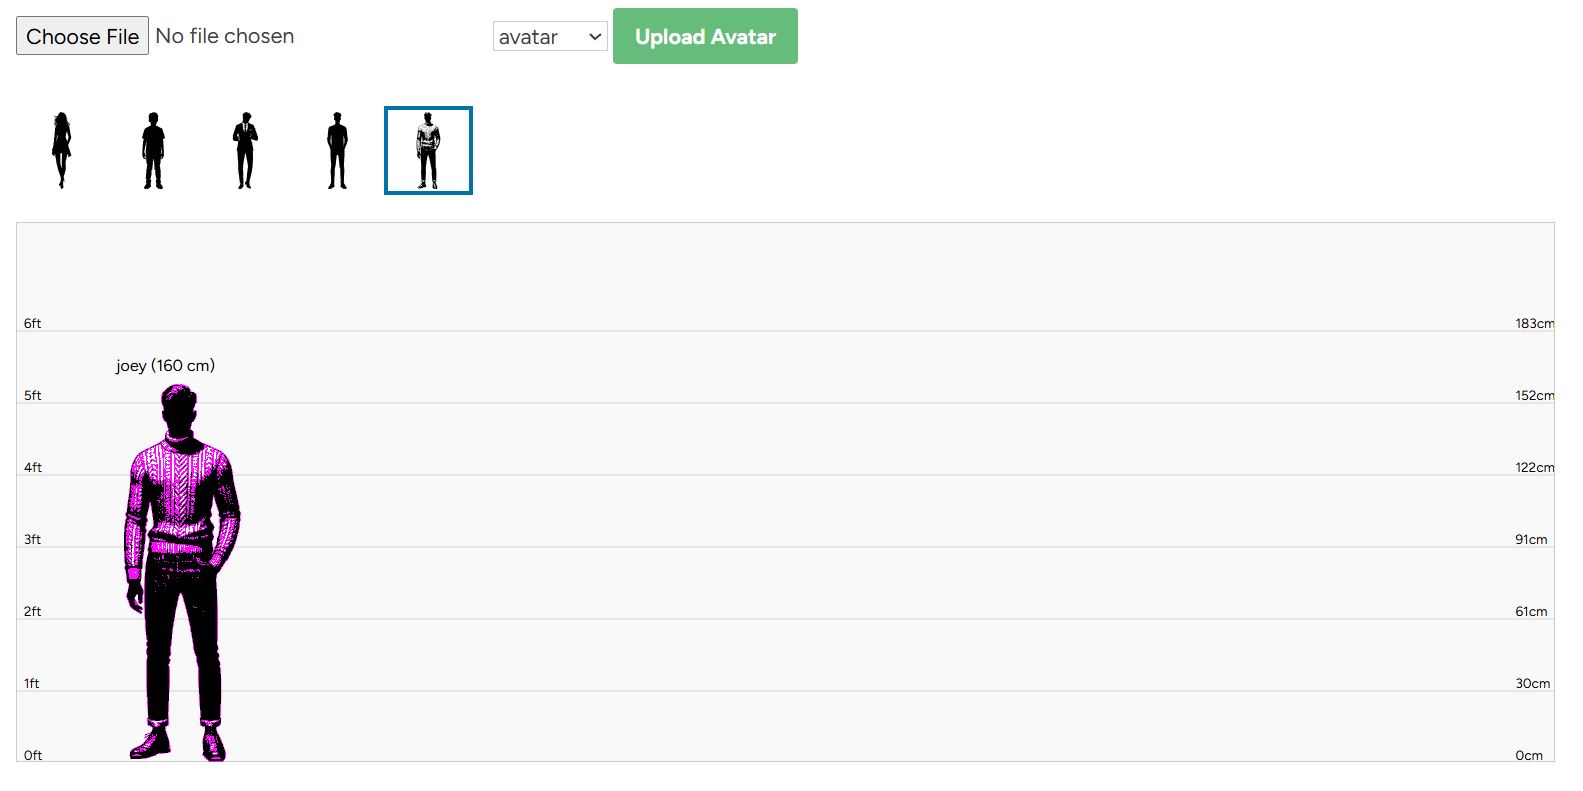
1. Avatar Category
- Select an avatar by clicking an avatar image in the avatar gallery (it will be highlighted).
- Enter a name and height (cm) in the input fields. This method allows manual input of any custom name and height.
- Click the Add button to add the figure to the height scale.
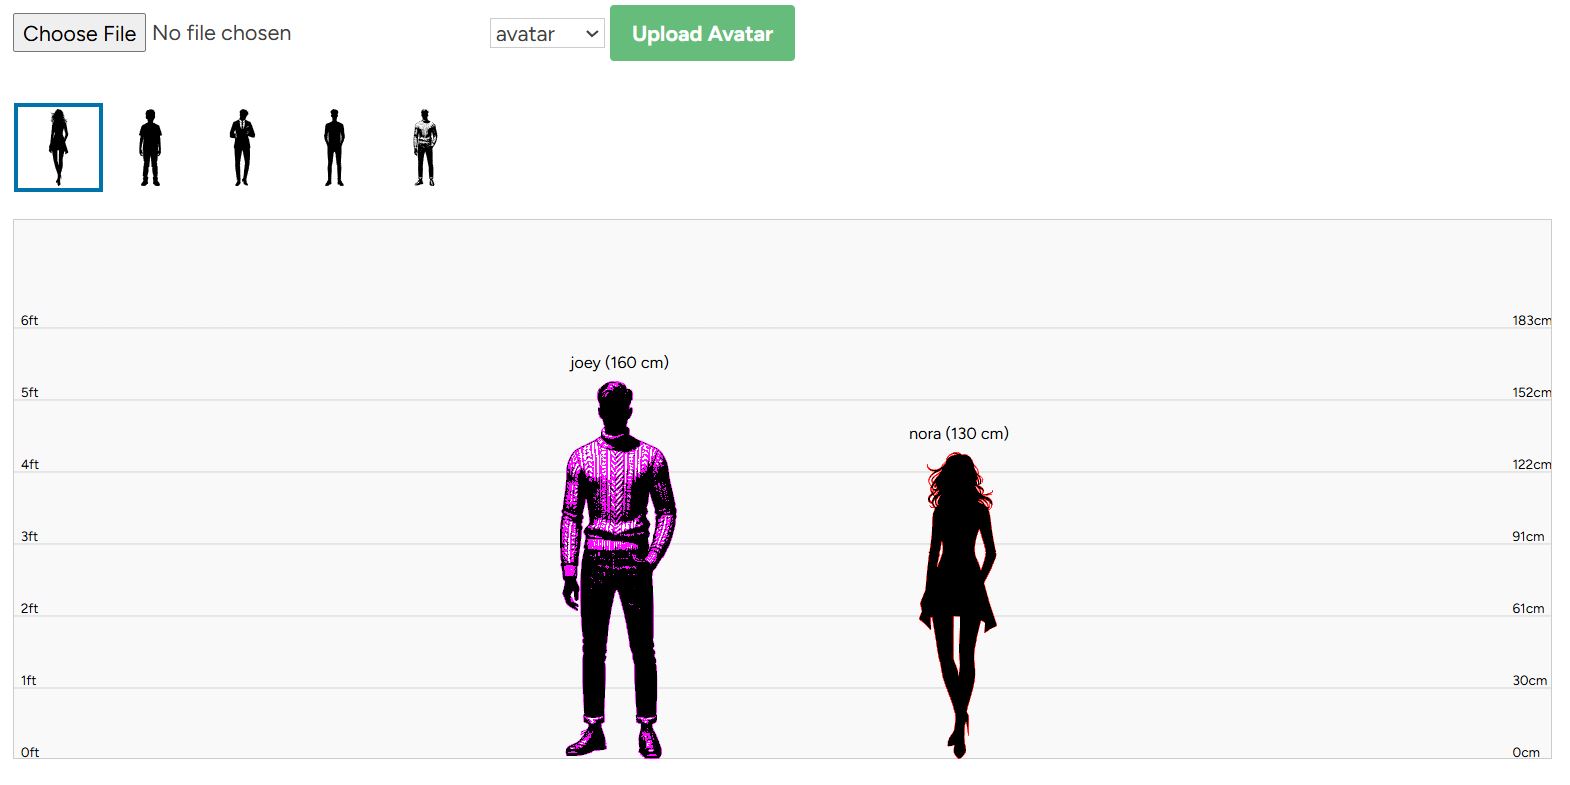
- Then you will see your name, height and avatar will be created from the chart above
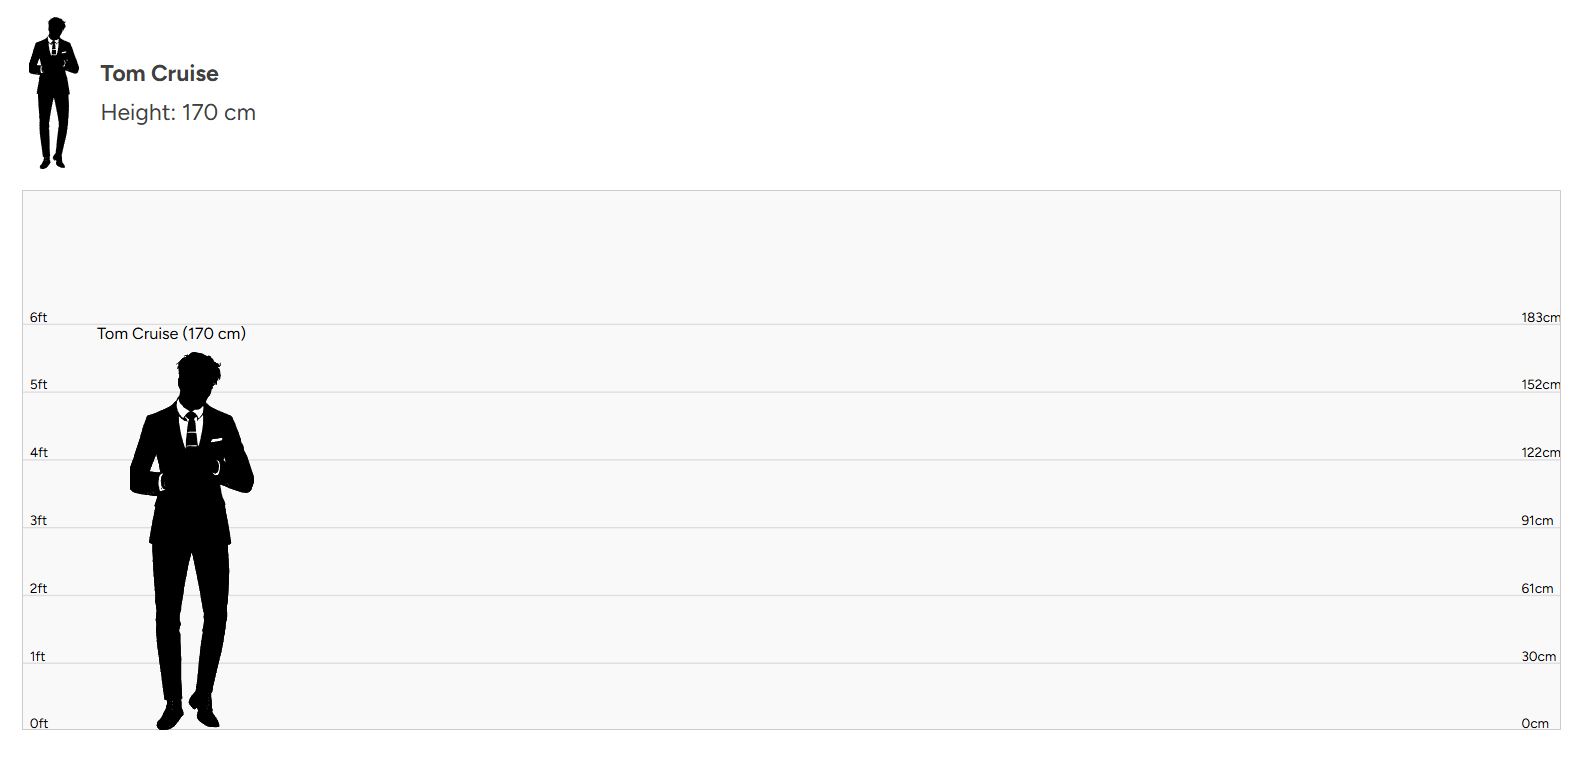
2. Celebrity Category
- A search bar appears to filter celebrities by name.
- Type part of a celebrity’s name to see matching results.
- Click a celebrity entry to immediately add it to the scale with the correct height and gender-specific avatar.
- Name and height are loaded automatically from the plugin’s celebrity data.

3. Entities (and Animals) Category
- Clicking an avatar image immediately adds it to the scale.
- Name and height are automatically extracted from the filename.
- No manual input needed.
Customizing Appearance
- Use the color picker or select a preset color swatch to choose a color effect for your figures.
- The color applies as a drop-shadow on the avatars on the scale.
Managing Figures on the Scale
- Figures are displayed proportionally according to their height.
- You can drag figures horizontally to rearrange their positions.
- Hover over a figure to reveal a delete (✖) button. Click it to remove the figure.
- Use the Clear All button to remove all figures from the scale at once.
Uploading New Avatars
- Use the upload form to add new avatars.
- Select the avatar image and assign it to a category.
- Uploaded avatars will appear in the chosen category after successful upload.
Entities
- There are entities like cars, buildings, structures that you can add on the graph above to show its scale.
- Just click the entities bar and select an item and will automatically added to the graph
- Beside these entities you can add your celebrity or personal avatar to view the scale or height difference between them
- There are a lot of variations you can do to visualize height differences
Notes
- The height scale adjusts dynamically to the tallest figure.
- For best mobile experience, avoid adding too many figures at once to prevent scaling issues.
- Filenames for entities and animals should include height in cm for accurate scaling.
If you need any help or want to suggest new features, feel free to contact your system administrator.
Height Difference Plugin Features
1. Multiple Categories / Tabs
- The plugin supports different avatar categories loaded dynamically from your server, e.g., avatar, celebrity, animals, entities.
- Each category corresponds to a folder containing SVG avatar files and a JSON index file listing available items.
2. Category Tabs UI
- Tabs/buttons for each category are dynamically created and displayed above the avatar gallery.
- Clicking a tab loads avatars or special UI for that category.
3. Avatar Gallery Display
- Displays available SVG avatars for the selected category.
- For avatar category: user must select an avatar, then input name and height manually.
- For celebrity category: shows a search bar to filter celebrity names, shows gender-specific avatar icons with height info, clicking an entry adds it directly.
- For entities (and others like animals): clicking an avatar directly adds it using name and height parsed from the SVG filename (e.g., “The_White_House_2100.svg” → height 2100cm, name “The White House”).
4. Color Selection
- A color picker and preset color swatches let the user select a color applied as a drop-shadow effect on the avatar images.
5. Upload Avatars
- An upload form allows users to upload new avatars (images) and select their category.
- Upon successful upload, the avatar list for that category reloads.
6. Adding Figures
- For avatar tab: user inputs name and height, selects an avatar, then clicks an Add button to add the figure to the scale.
- For other tabs (celebrity, entities, etc.): clicking an avatar immediately adds the figure with its data.
7. Height Scale Canvas
- A vertical height scale with both feet and centimeters markers is rendered in an SVG canvas.
- Height markers adjust dynamically based on the tallest figure added.
- Feet and cm labels are shown alongside lines for reference.
8. Figures Displayed on Scale
- Added figures are displayed as SVG or image avatars positioned on the scale according to their height.
- Each figure has a label showing the name and height.
- Figures are horizontally spaced on the container.
- Figures have draggable wrappers, letting users drag horizontally to rearrange.
9. Delete Figures
- Each figure wrapper shows a small delete (“✖”) button on hover.
- Clicking delete removes the figure and re-renders the scale.
10. Clear All
- A Clear All button clears all added figures from the scale.
11. Responsive Behavior
- Current horizontal spacing is fixed but we are working on making it responsive to fit properly on smaller screens (mobile).
Summary of Behavior by Tab
| Tab Category | Avatar Selection & Addition | Height & Name Source |
|---|---|---|
| avatar | User clicks an avatar to select (highlighted), then inputs name and height manually, then clicks Add button to add | User inputs manually |
| celebrity | Search bar to filter by name; clicking a celebrity auto-adds with predefined height and name from JSON data | From JSON data with gender-based avatar icons |
| entities | Clicking an avatar directly adds it with name and height parsed from the SVG filename | Extracted from filename (e.g., “180cm_Name.svg”) |
| animals (similar to entities) | Clicking adds avatars immediately with height from filename or default height | Filename or default height |
Frequently asked questions
1. Is Heightdifference.net free to use? Yes, the basic features of Heightdifference.net are completely free. You can compare heights, use pre-loaded data, and create simple visualizations at no cost. However, our Premium Membership unlocks advanced features for a richer experience.
2. Can I compare more than two heights at once? Absolutely! Our platform supports multiple height comparisons, so you can create group visualizations or compare multiple individuals and objects in one view.
3. What customization options are available? Even with the free version, you can customize avatars with basic colors and styles. Premium Membership unlocks advanced options like custom labels, gradients, and additional avatar slots.
4. What is included in the height database? Our height database includes popular celebrities, historical figures, fictional characters, and more. Premium users get access to an extended library with exclusive data.
5. How do I share my comparisons? Once you create a height difference, you can save it as an image or directly share it on social media platforms. It’s quick, easy, and perfect for sparking conversations!
6. How is my data handled? We prioritize your privacy. No personal data is collected unless you opt for Premium Membership, and even then, it’s securely handled.
7. What devices can I use Heightdifference.net on? Our platform is fully compatible with desktops, tablets, and mobile devices. You’ll have the same great experience no matter where you are.
The Importance of a Height Difference Chart
A height difference chart is a visual tool that allows individuals to compare the relative heights of two or more figures — whether those figures are real people, characters, objects, or conceptual models. While it may seem like a simple visual aid, it serves multiple valuable functions across fields ranging from education and design to entertainment and accessibility.
1. Enhances Visual Understanding of Proportions
Humans often struggle to understand numerical differences in isolation. Saying someone is “6 feet tall” and another is “5’2” doesn’t always convey a clear image of their height disparity. However, a height difference chart translates those numbers into an immediate visual context. This comparison gives the viewer an accurate sense of scale, making abstract numbers tangible.
2. Supports Better Design and Planning
In fields like architecture, interior design, ergonomic product design, and fashion, understanding relative human height is crucial. Designers use height charts to test proportions, accessibility, and comfort. For example:
- Furniture must accommodate people of various heights.
- Doorways, shelves, and workstations should meet safety and usability standards.
- Fashion brands use height comparison tools to model how clothes fit on different body types.
These comparisons help designers create inclusive and practical environments for real-world use.
3. Useful in Education and Child Development
Educators and parents use height charts to track growth over time, which is particularly important in early childhood development. Comparing a child’s height to standard growth charts or to peers gives insights into health, nutrition, or developmental conditions. A visual chart also helps children understand their growth in a fun and engaging way.
In schools, height difference charts are used in lessons about measurement, statistics, biology, and even social studies when discussing population diversity. They allow for interactive learning by helping students grasp abstract concepts like averages, percentiles, or global height differences.
4. Essential for Online Fitting and Virtual Avatars
With the rise of e-commerce and virtual fitting rooms, especially in the fashion and gaming industries, height charts play a key role in enhancing user experience. Brands that sell clothing, sports gear, or accessories now provide visualization tools where customers input their height and body proportions to see how items fit on a model.
In video game character customization or virtual world platforms, height comparison tools help players visualize their avatars alongside others. This creates a sense of realism and identity in digital spaces.
5. Helps in Social Contexts and Entertainment
In pop culture and fandom communities, height difference charts are widely used to compare characters in movies, TV shows, anime, and books. Fans are often curious to see how tall one character is compared to another. These comparisons help in fan art, cosplay, and content creation, and can even be a source of humor or personality analysis.
In sports and dating contexts, height also holds social relevance. People may compare their height to that of athletes, celebrities, or prospective partners. A visual chart makes this comparison more engaging and less abstract.
6. Assists in Safety and Accessibility Planning
In safety-critical industries such as aviation, military, and transportation, height difference data affects equipment design, training protocols, and safety gear fitting. For instance:
- Pilots must fit within certain height ranges for cockpit ergonomics.
- Firefighter gear or parachutes must be tailored to fit different body sizes.
Even public facilities — such as escalators, public toilets, and amusement park rides — use height charts to determine who can safely use a space or equipment.
7. Personal and Fun Utility
On a personal level, height comparison charts are fun and memorable. Families use them to track children’s growth, couples use them to joke about their height gaps, and friends might use them to create humorous memes or birthday cards. These charts humanize data and create lasting memories through visual storytelling.
A height difference chart here at HeightDifference.net may appear simple, but its utility spans multiple sectors — from health and safety to education, design, and entertainment. It transforms abstract measurements into relatable visuals, helping people of all backgrounds understand, plan, and engage more meaningfully with the concept of height. Whether used for serious design needs or just for fun, it’s a versatile and impactful tool that bridges the gap between numbers and visual understanding.